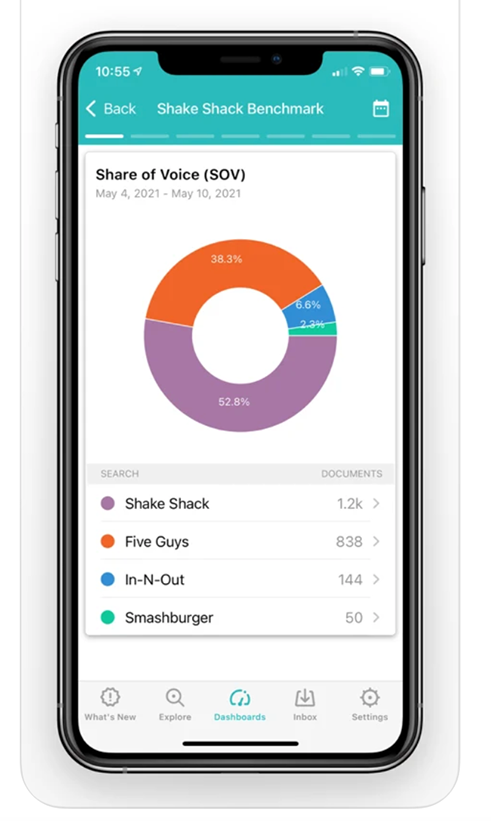
Meltwater's media monitoring app, used predominately by PR teams, allows customers to input keywords and search 200+ billion sources of news articles and social media posts. By using dashboards, customers can measure the percentage of the market that they and their competitors own based on share of voice — and analyze the sentiment of those conversations.
LEAD UX DESIGNER ON THE DASHBOARDS & WIDGETS
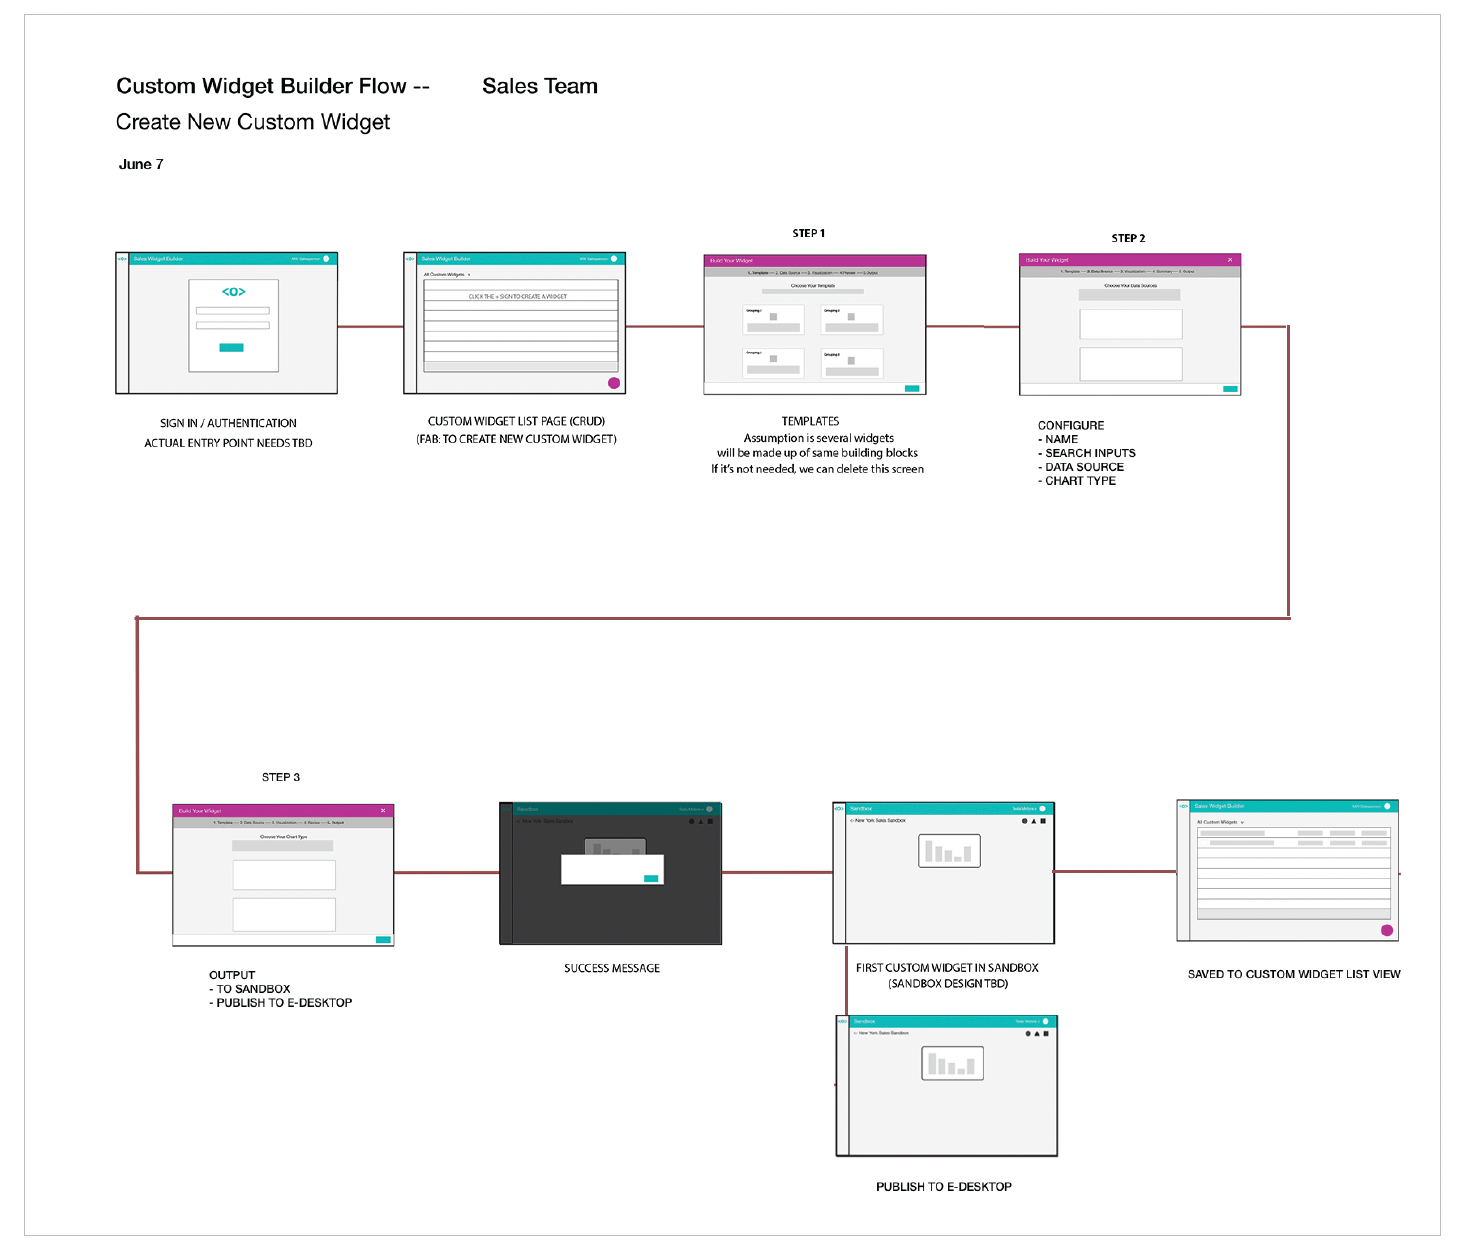
The work I performed included reimagining the dashboard experience. In tandem with a company-wide app design system migration, I proposed a redesign, starting with sketches and flows mapping, wireframes and medium fidelity mocks to communicate concepts.
I created plans for dashboard onboarding including the use of templates for common dashboard types. My work focused on solutions for our sales teams and our customers alike for easier configuration of dashboards, designing new widgets, chart design including chart drill down views, and new custom settings.
I researched user pain points, parsed and synthesized ongoing app feedback, and I engaged small subsets of users in usability testing before development. Following a continuous delivery mindset, our agile team would get the feature out there in MVP format and follow up with talking to customers to see how they liked it and iterate from there. We employed beta soft launches to try out the new features.
NEW BUSINESS
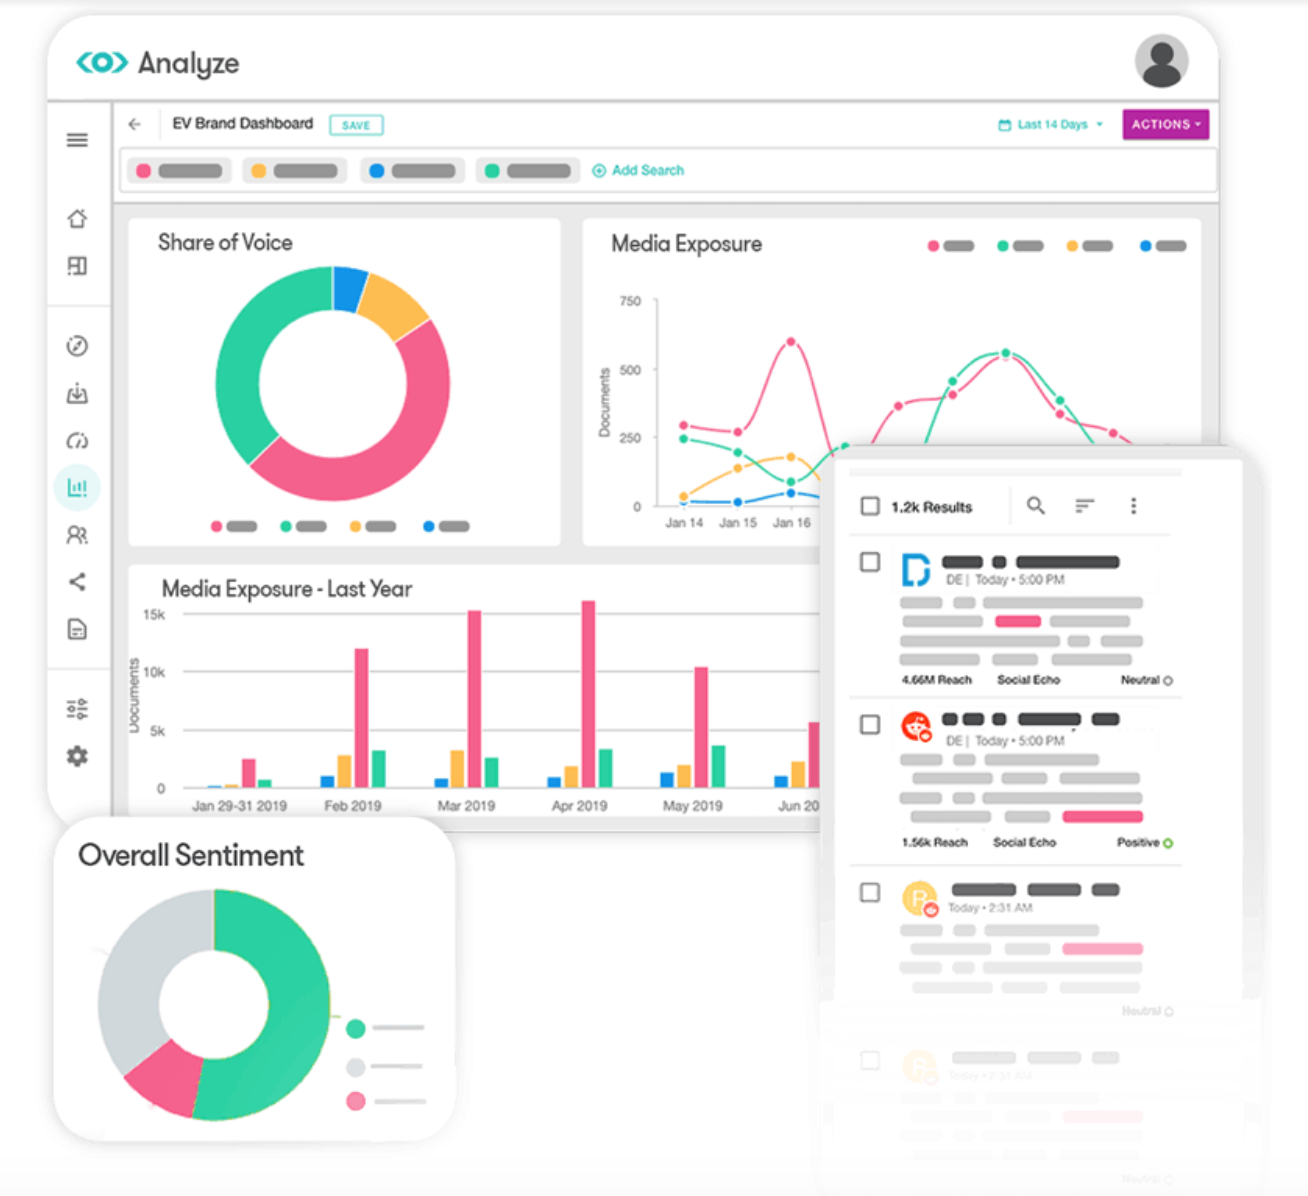
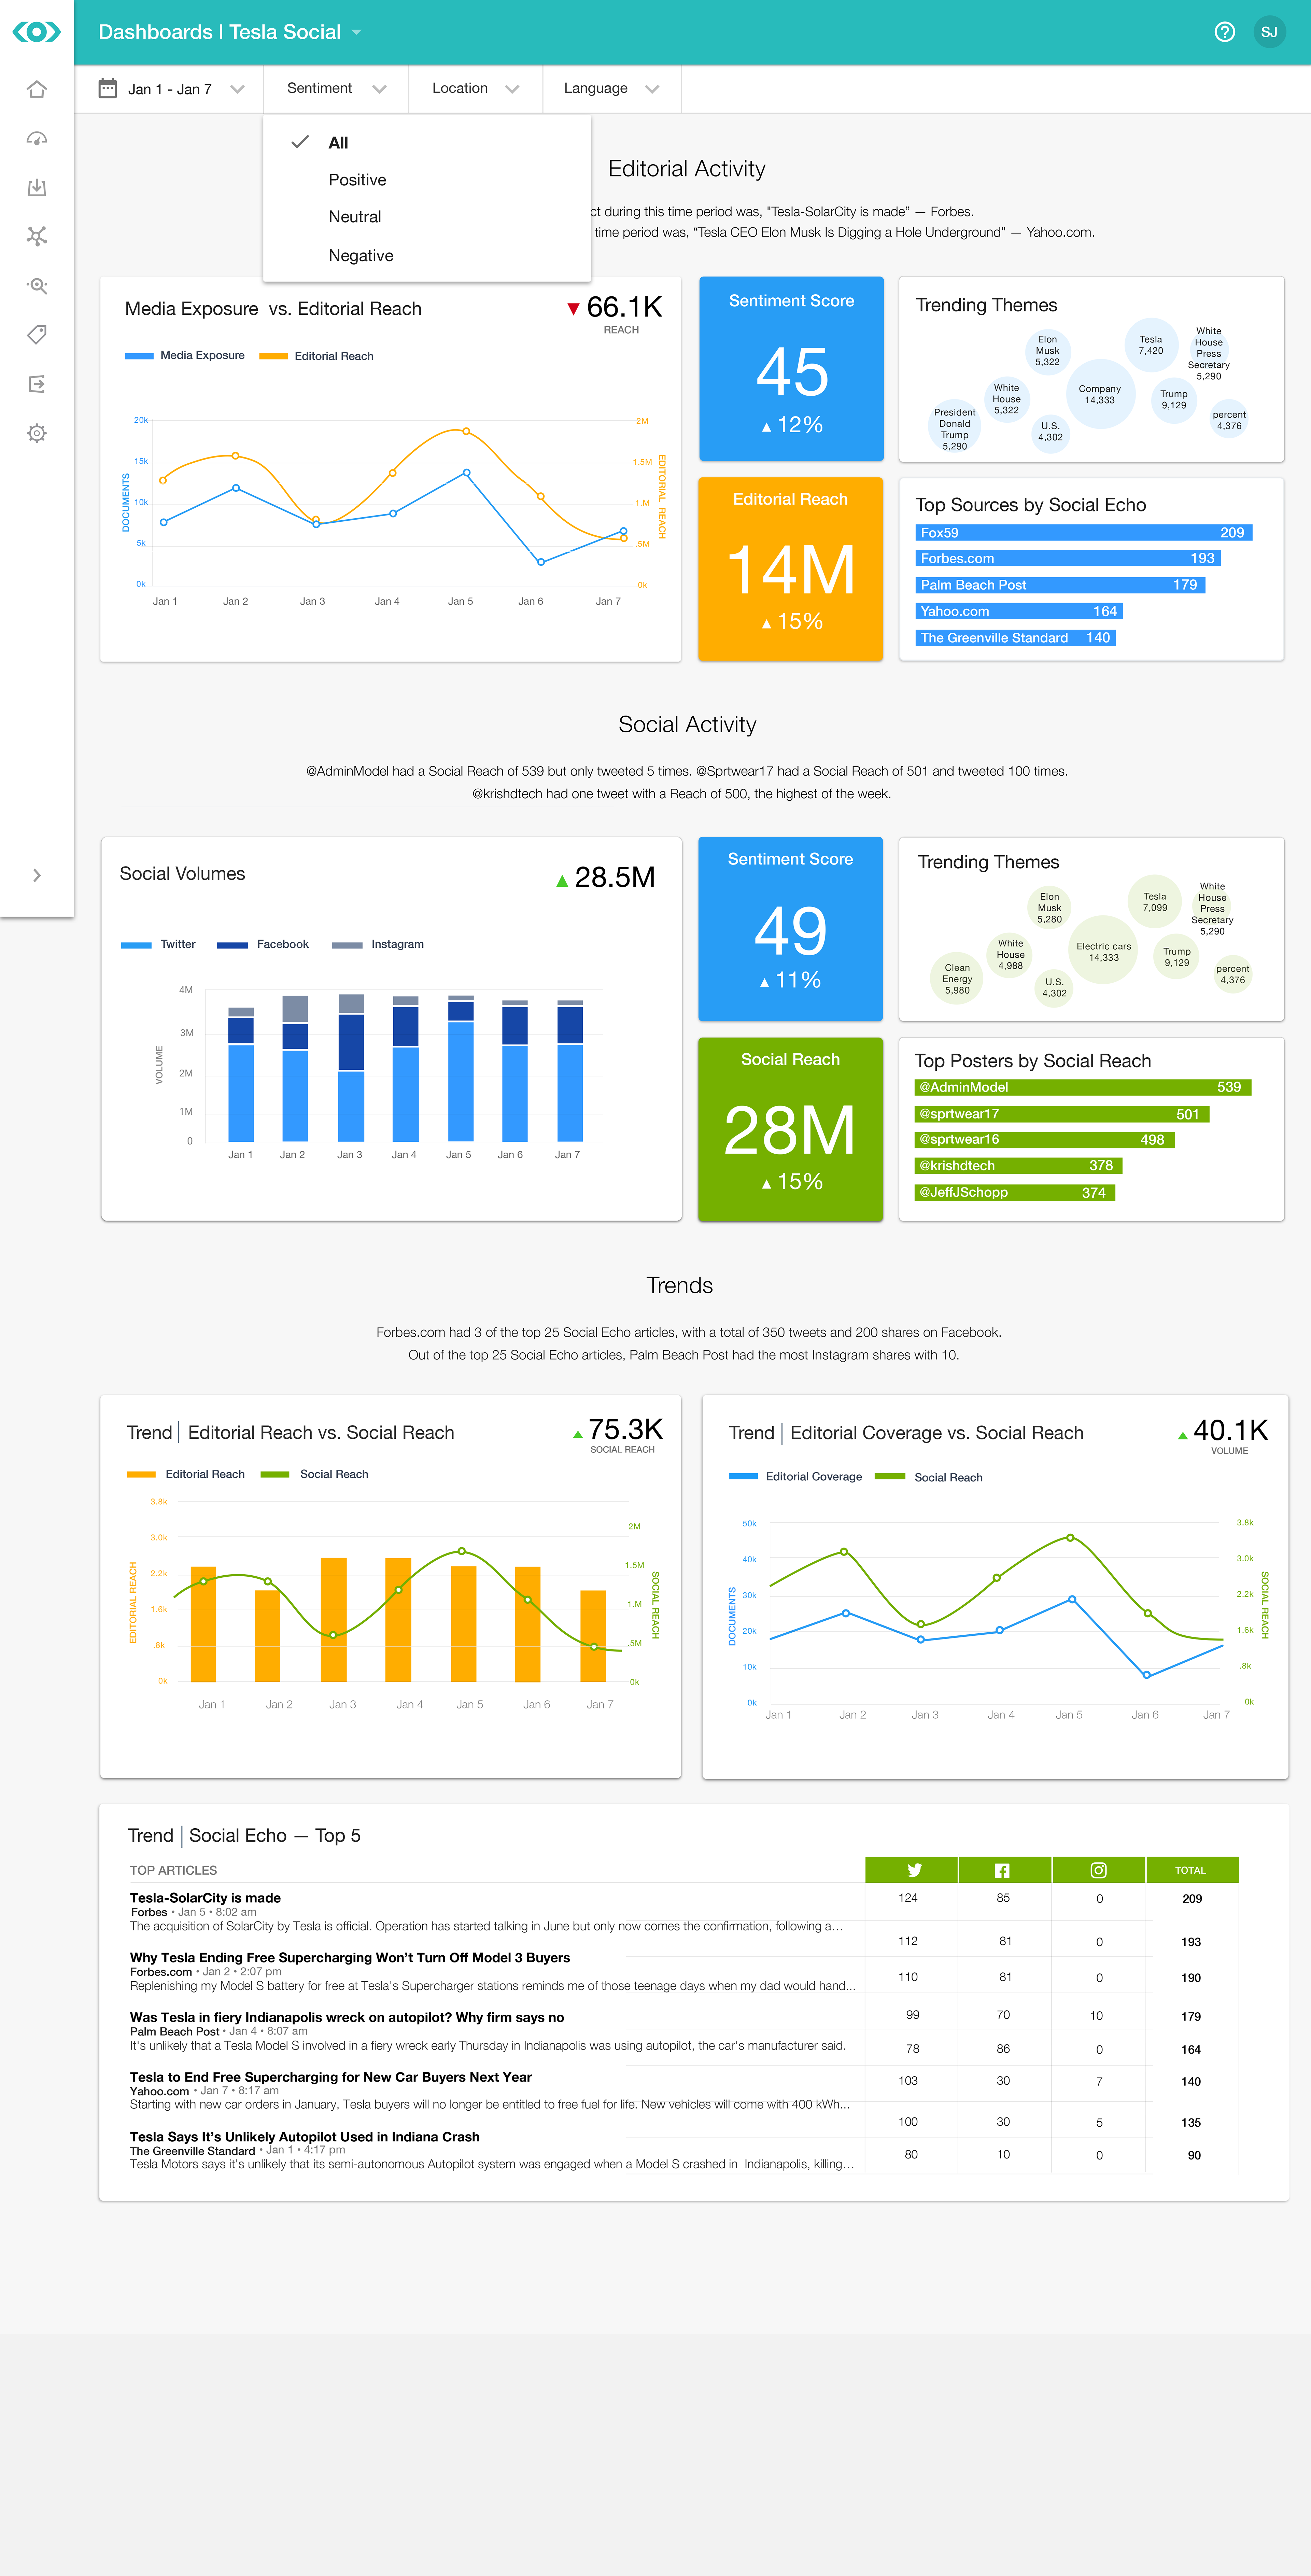
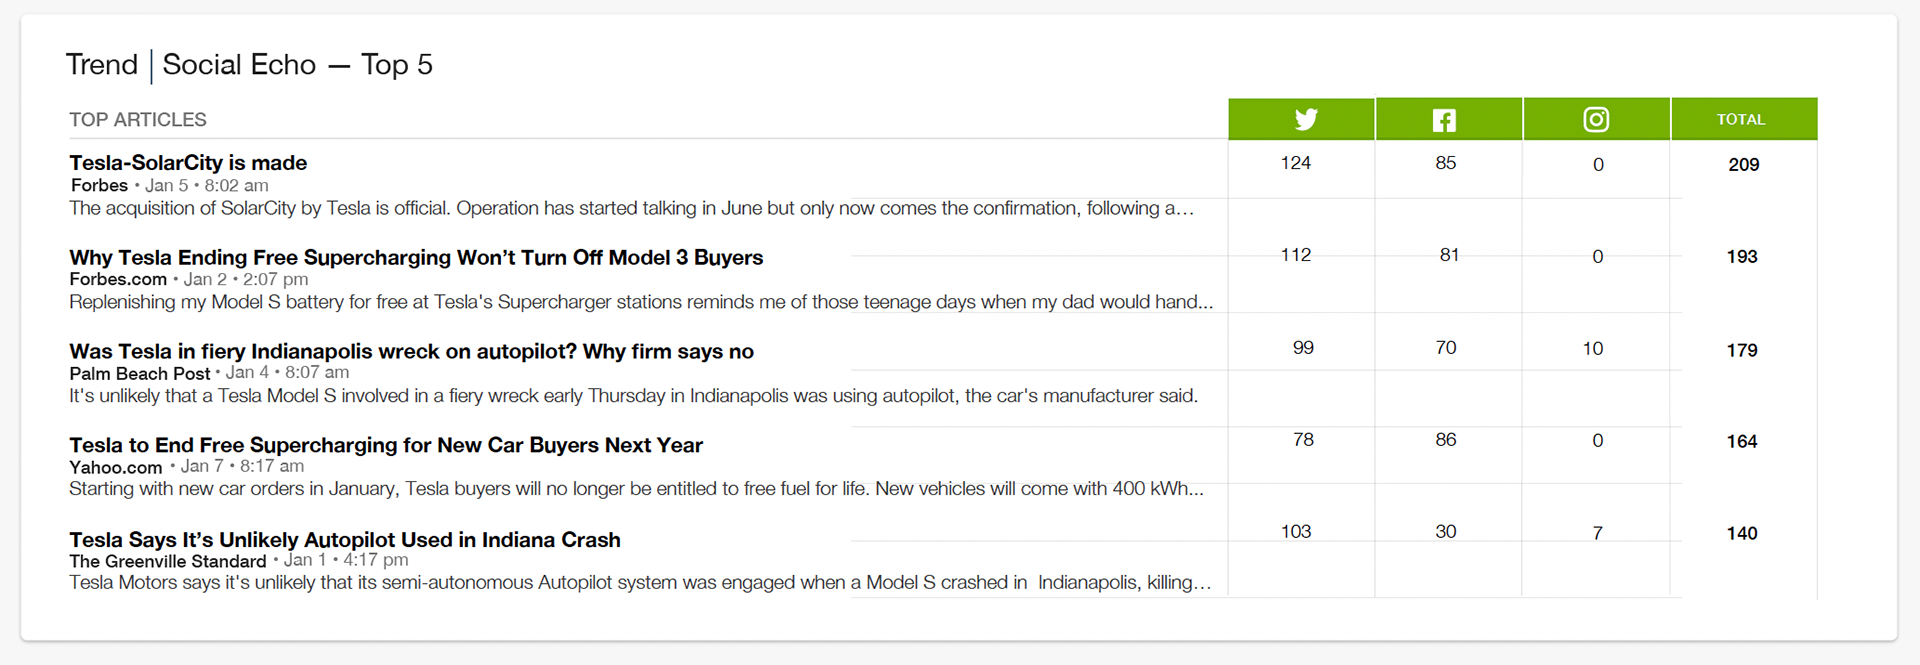
The work that I was focused on during my time at Meltwater encompassed new dashboard product concepts, and configuration and flows for our sales team that was looking to sell custom widgets and APIs. In addition, I designed a new social media dashboard that synthesizes main themes and insights, making it easier for customers to instantly understand top trends and scan their dashboards for important information.
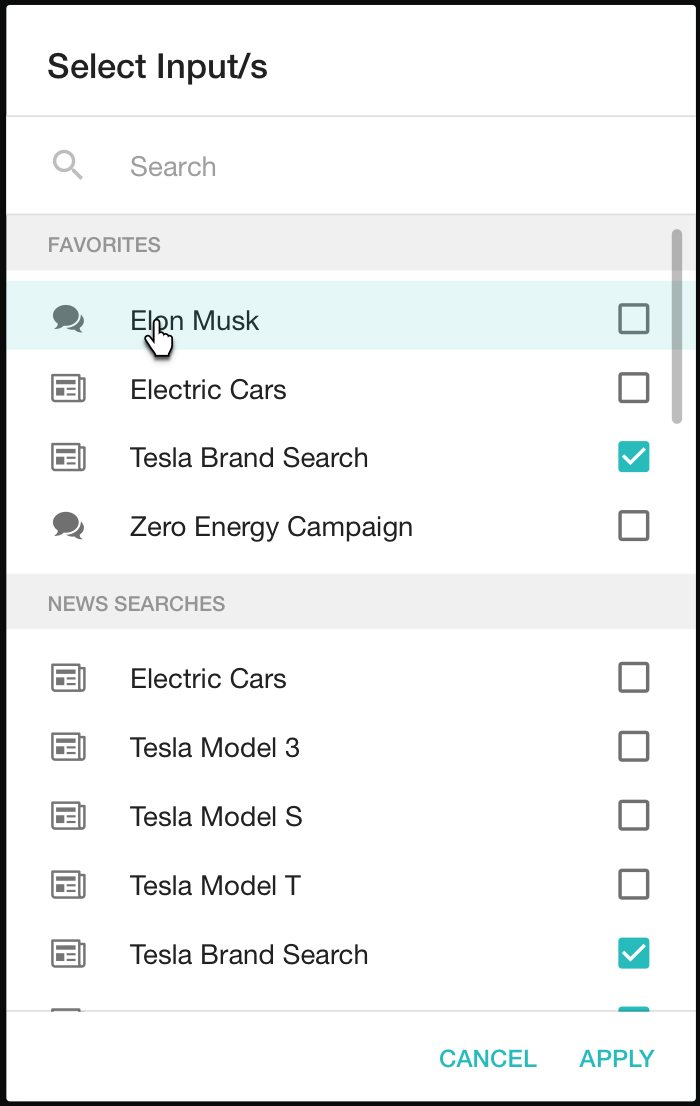
FLOW DESIGN
NEW WIDGET DESIGN
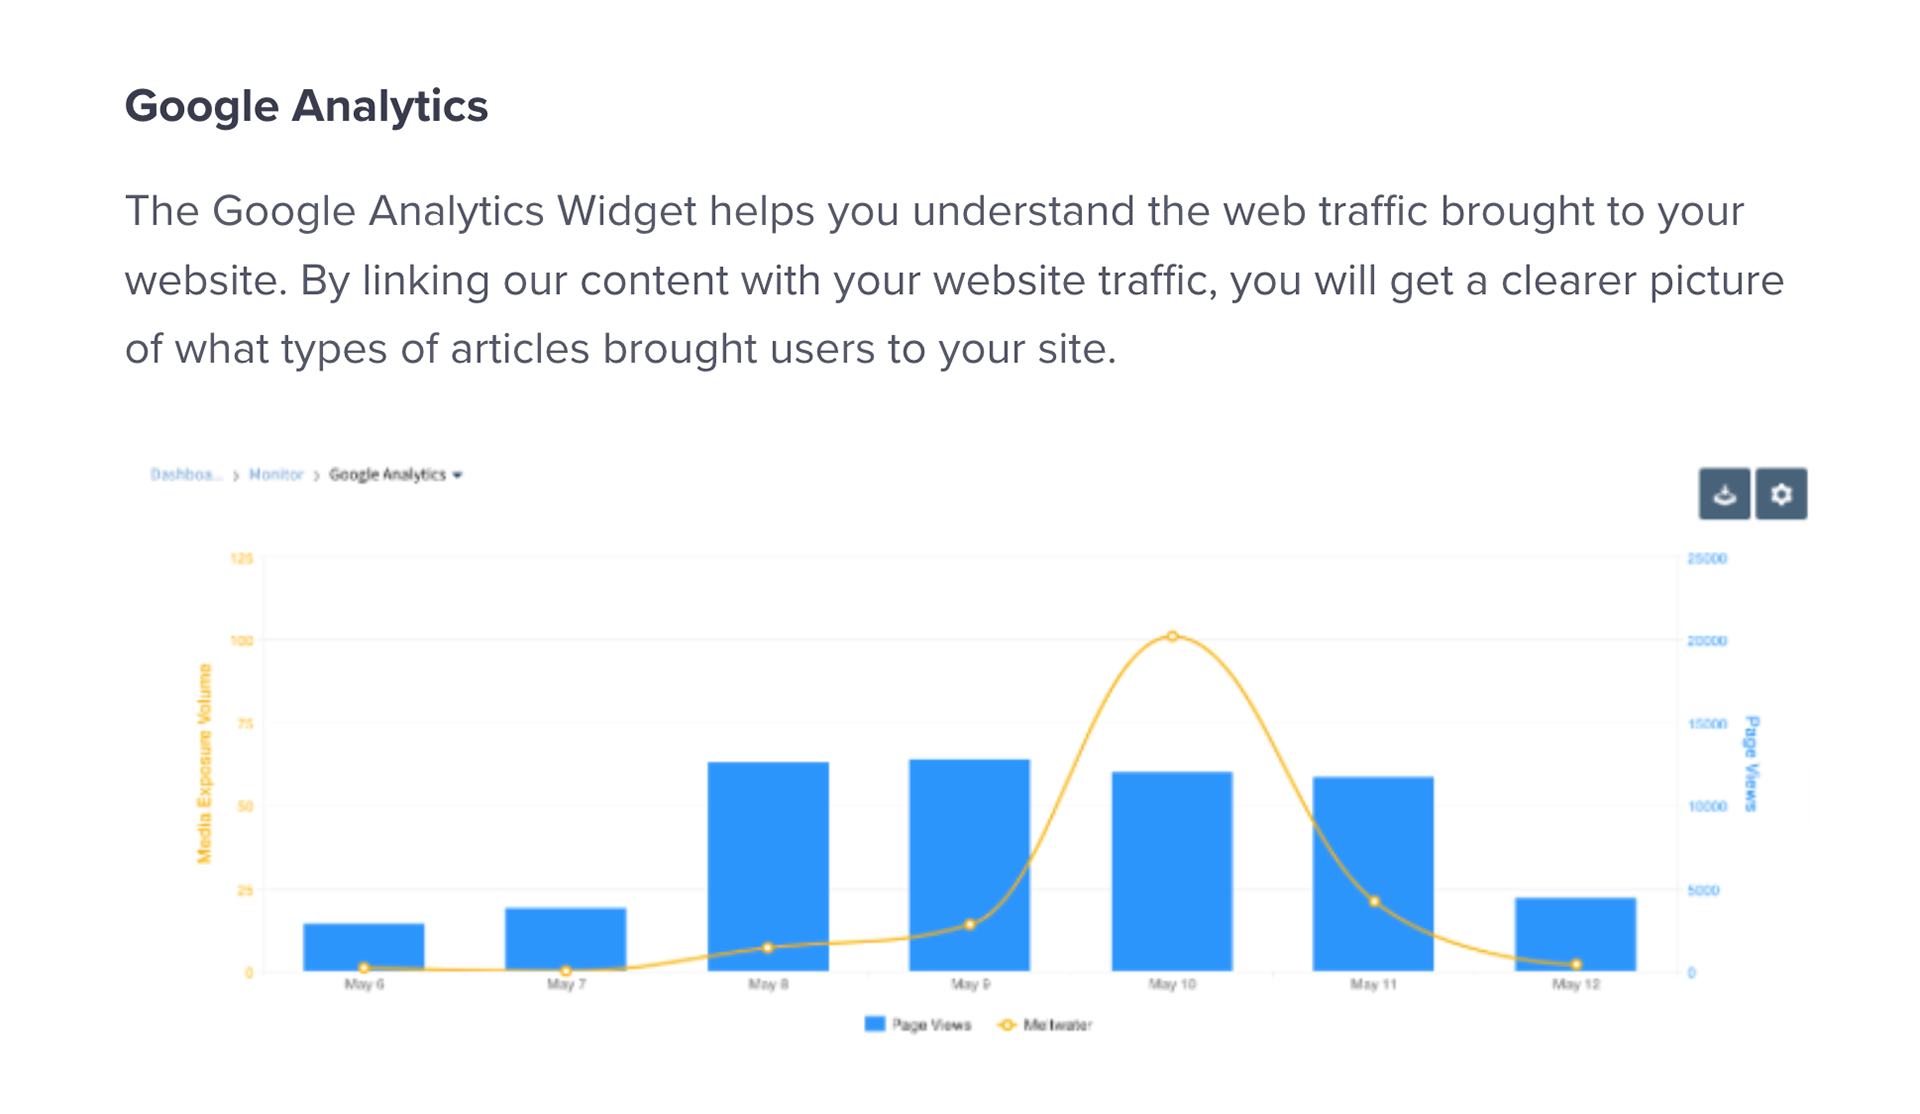
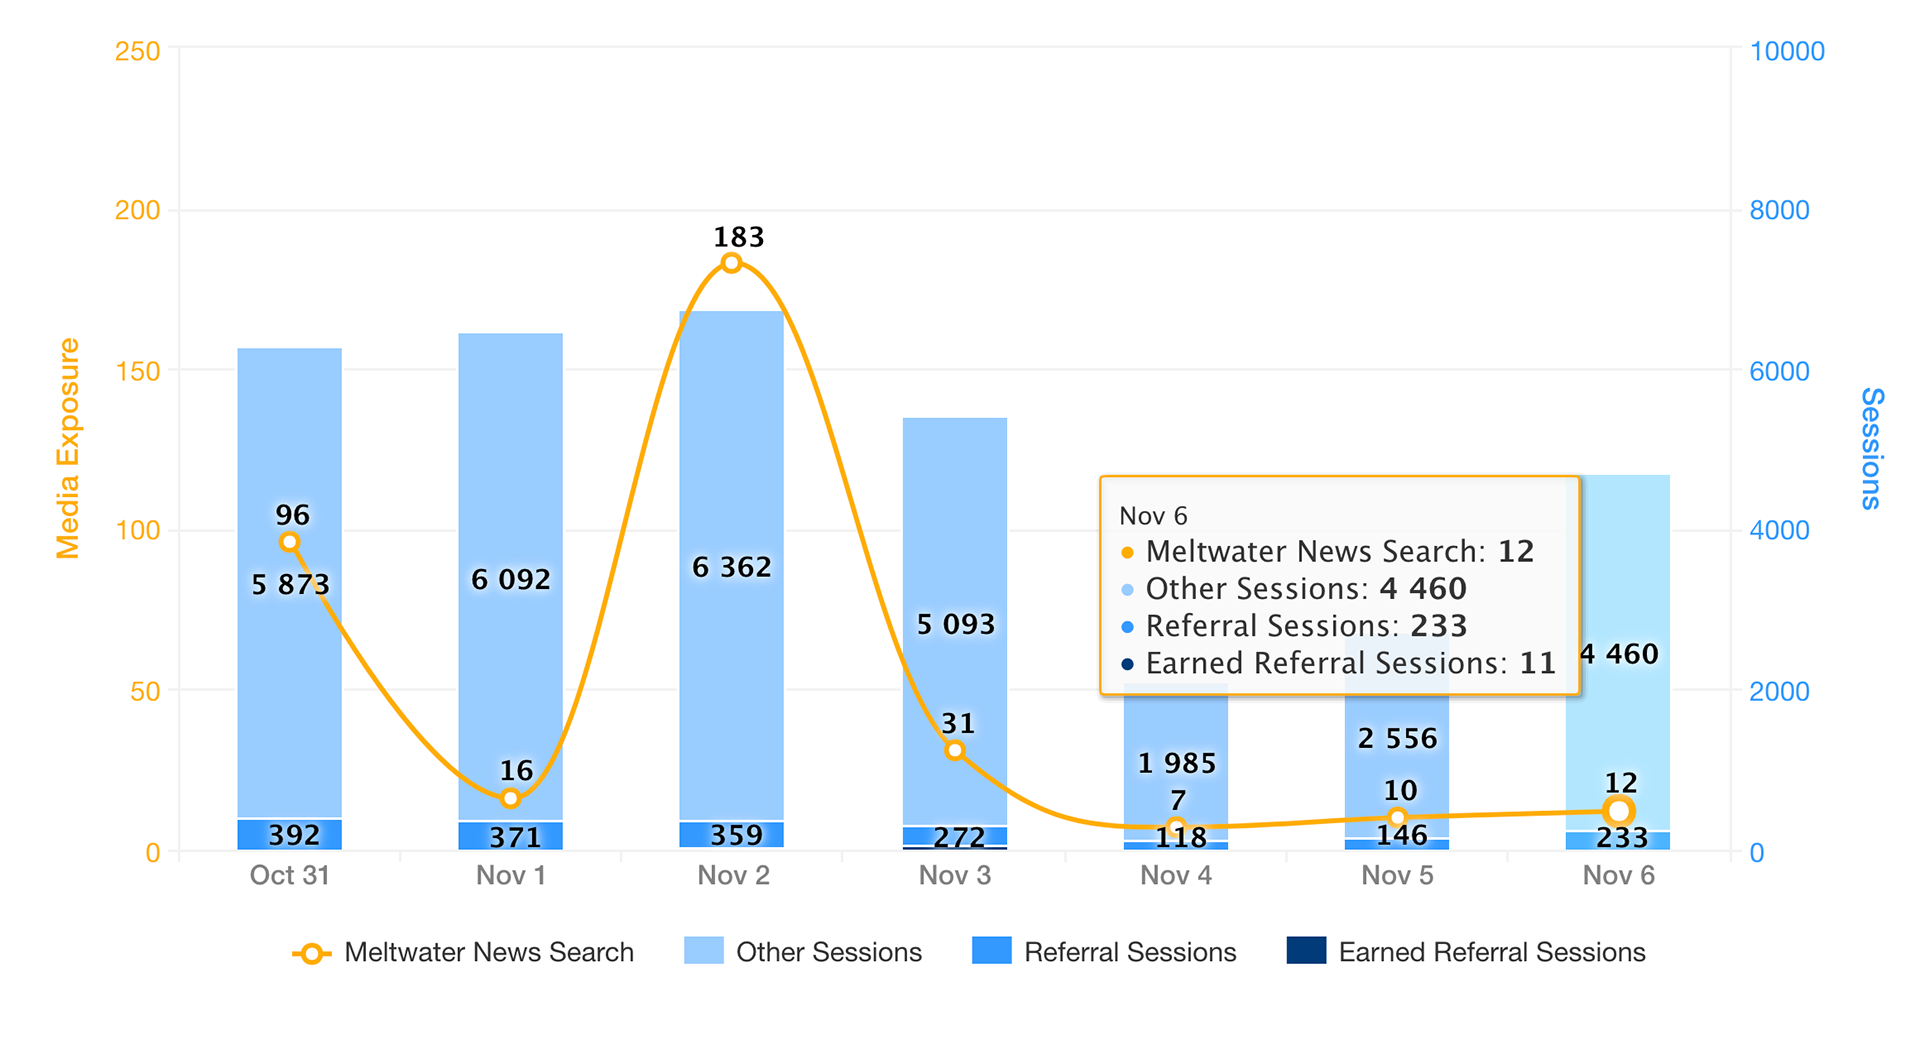
Running a social media campaign to increase traffic to the company blog can be measured with the Google Analytics widget by looking at social media exposure compared to an increase in page views.
The Google Analytics widget displays the page views and referred sessions to a selected website against the media exposure for a news or social search for up to 90 days. Customers can observe any correlations between the media exposure (for press releases, blog posts, social media campaigns, etc.) and the traffic leading to their websites.
“You have to start with the customer experience and work your way back to technology.”
— Steve Jobs